

|
This was first published on https://blog.dbi-services.com/trying-appdynamix-monitoring-application-from-user-to-database (2015-11-24)
Republishing here for new followers. The content is related to the the versions available at the publication date
I like to come upon new monitoring software that help to go quickly from user response time to root cause. And I love applications that can be installed easily and at which I can give a try without reading pages of manual.
At DOAG 3rd floor I’ve visited the AppDynamics booth and immediately wanted to install the trial version and give it a try.
From the AppDynamics website, there is a 15 days trial version that you can download. I’ve downloaded the Linux version (controller_64bit_linux-4.1.7.0.zip) because I want to try it on our Oracle Tuning workshop VM. It’s 500MB and when you unzip you get two files:
oracle@vmoratun201:/tmp/appdynamics/ [DB1] unzip controller_64bit_linux-4.1.7.0.zip
Archive:  controller_64bit_linux-4.1.7.0.zip
  inflating: controller_64bit_linux-4.1.7.0.sh
  inflating: license.lic

oracle@vmoratun201:/tmp/appdynamics/ [DB1] ls -l
total 1084416
-rw-r--r--. 1 oracle oinstall 559790650 Nov 20 21:33 controller_64bit_linux-4.1.7.0.sh
-rw-r--r--. 1 oracle oinstall 550634894 Nov 23 20:35 controller_64bit_linux-4.1.7.0.zip
-rw-r--r--. 1 oracle oinstall      1997 Nov 22 12:43 license.lic
Yes… a 500MB ‘.sh’ to run as a shell script. If you look at it, it embeds some binary code at the end of the script.
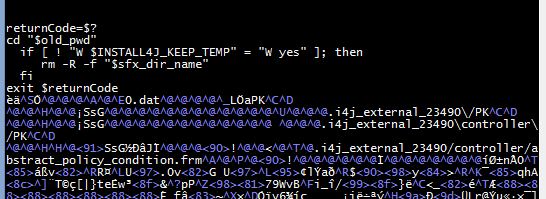 Funny isn’t it? I like this idea…
Then just run it
oracle@vmoratun201:/tmp/appdynamics/ [DB1] sh controller_64bit_linux-4.1.7.0.sh
Unpacking JRE ...
Preparing JRE ...
Starting Installer ...
You have a graphical wizard and after a few next-next-next you can connect to the server with a browser:
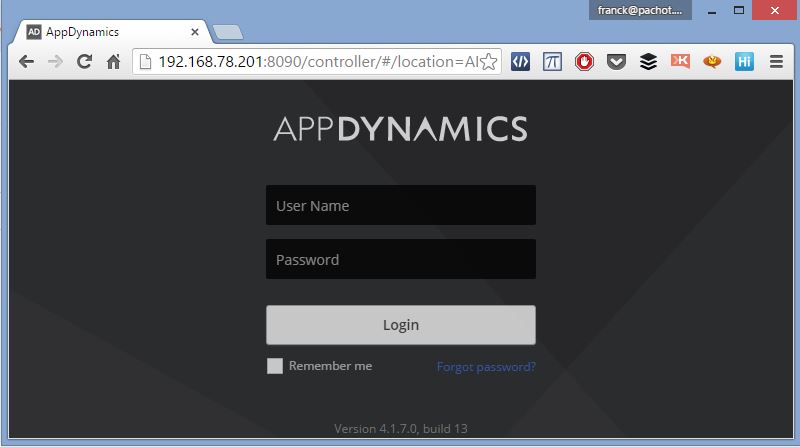
Then it’s very easy. Look at what you can monitor:
I have to set database type (Oracle) and the url of my controller.
The wizard ask you download the database agent (dbagent-4.1.7.0.zip). I just get the url from there and download it in my VM with wget:
oracle@vmoratun201:/tmp/appdynamics/ [DB1] wget https://download.appdynamics.com/self_service/agent/dbagent/2
--2015-11-23 21:30:12--  https://download.appdynamics.com/self_service/agent/dbagent/21cea4f9066d3131435bbf01
Resolving download.appdynamics.com... 54.244.244.230
Connecting to download.appdynamics.com|54.244.244.230|:443... connected.
HTTP request sent, awaiting response... 200 OK
Length: 39230821 (37M) [application/zip]
Saving to: “dbagent-4.1.7.0.zip”

36% [=======================>                                            ] 14,253,827   191K/s  eta 2m 4s
Then follow the instructions:
unzip dbagent-4.1.7.0.zip
java -jar db-agent.jar
The agent knows where is the controller (probably from the download url) and connects to it once started. I am still in the wizard, waiting to receive that connection:
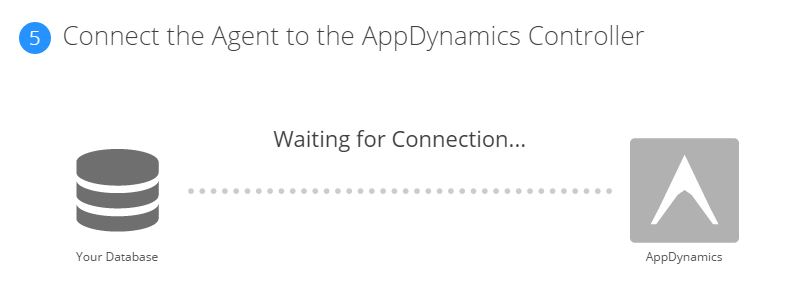 and a few minutes later:
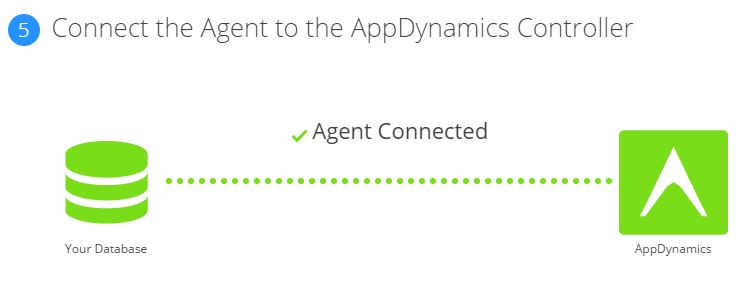
I really like those simple easy things… It tells you to wait 3 minutes and 3 minutes later you get it.
The wizard asks connection information to my database (host, port, service, user, password) and it’s ready to monitor:
Not very exiting yet? I’ve run SwingBench for few minutes. Let’s click on ‘Metrics Browser’ and choose some statistics to monitor:
 And that’s only a small part of the product, after only one hour installing it and running it without reading any documentation.
It can do lot more.
I’m running SwingBench here and it’s Java. I can monitor Java, from main calls to JDBC calls, and match it with the database time.
This is the point: you drill down from the user response time through the profiling of the java methods, and when you are in a jdbc call, then you drill down to the database time. But that’s for future blog posts.